
Producing Automated Outputs (using Stata)
Presenter(s): Dr Roxanne Connelly
Presenting statistical results is a key part of undertaking quantitative social science research. There are great benefits to automating the production of statistical outputs. Automation will promote efficiency and reproducibility, and reduce the opportunity for error. Cutting and pasting results is a recipe for disaster and should always be avoided.
This online resource provides examples of how to automate the production of statistical outputs using Stata. The examples provided use several different commands and demonstrate how to make and format tables of different types of statistical results. ,
Working through the examples below should help you get to grips with the Stata commands, and enable you to apply them to your own data analysis.
Producing Automated Outputs (using Stata)
Note: The resources below use several built in commands which are new to Stata 17. You will need to have Stata version 17 (or higher). To ensure you have all the latest built in Stata commands installed you should regularly update Stata. You can do this by running, update all. If you are using a computer managed by your university or organisation you may need to have administrator rights to update Stata. You can check when Stata was last updated by running, update query.
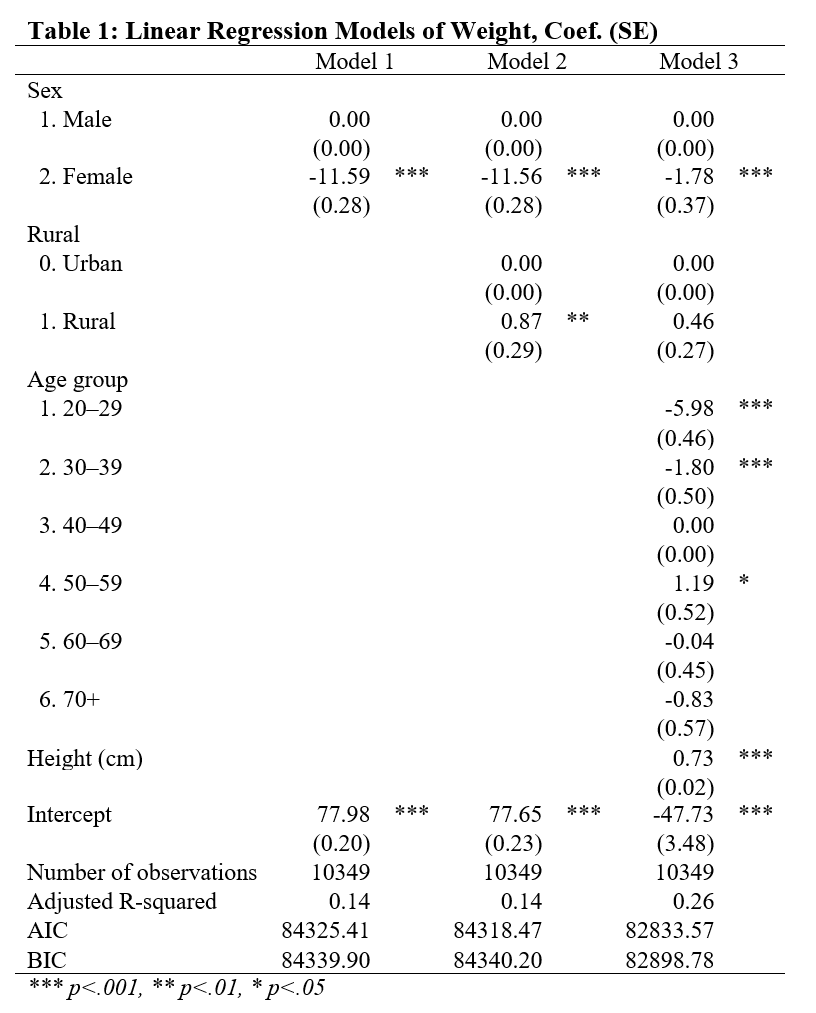
Tables of Regression results
This file introduces code to produce Word tables of regression results. Examples are provided using the etable and collect commands, the estout commands, and the asdoc command. Examples are also provided for regression models using complex survey data.
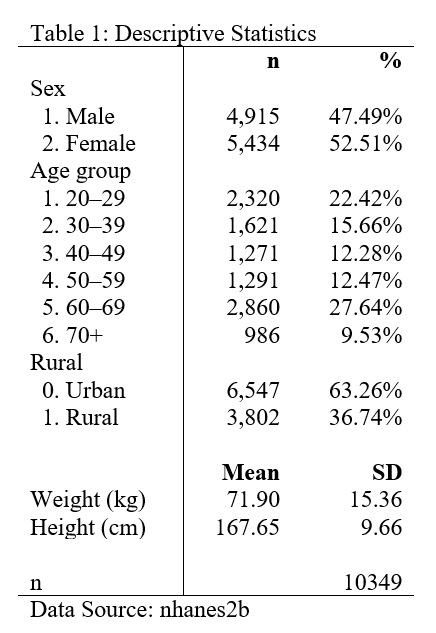
Tables of Univariate Descriptive Statistics
This file introduces code to produce tables of univariate descriptive statistics (e.g. frequency, percentage, mean, standard deviation). These simple descriptive tables often appear as the first table in social science research reports. Examples are provided using the collect commands, the estout commands, and the asdoc command. Examples are also provided for analyses using complex survey data.
Outputting Saved Results
There are times when it is useful to output individual results to be used in the text of a report (e.g. in a Word file). This file will demonstrate how to output saved results to Word files using the putdocx commands.


About the author
Dr Roxanne Connelly is a Senior Lecturer in Sociology and Quantitative Methods. Areas of research fall in the interconnected fields of Social Stratification and the Sociology of Education and methodological interests include techniques for the analysis of complex social survey data, longitudinal data analysis, administrative data, and open social science.
- Published on: 21 June 2022
- Event hosted by: University of Edinburgh
- Keywords: |
- To cite this resource:
Dr Roxanne Connelly. (2022). Producing Automated Outputs (using Stata). National Centre for Research Methods online learning resource. Available at https://www.ncrm.ac.uk/resources/online/all/?main&id=20788 [accessed: 26 April 2024]
⌃BACK TO TOP