
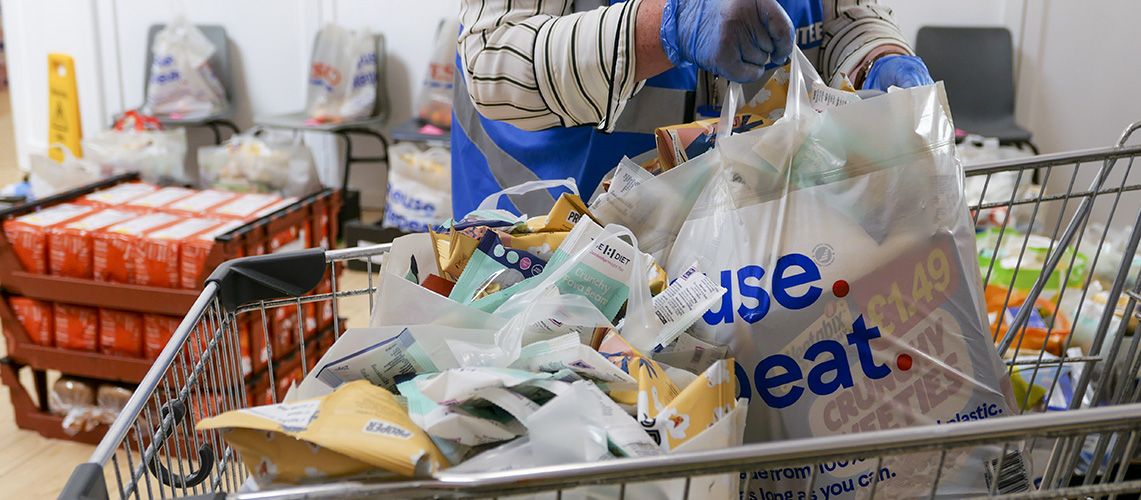
 Bags of food being prepared by a volunteer in a charity food bank centre
Not having enough food to eat, or food that contributes to a nutritious diet is food insecurity, or sometimes called food poverty. Sadly, this is a situation we hear a lot about in the news, from stories of more people using food banks than before or having to decide whether to heat their homes or eat. Energy prices remain high, and this added cost to monthly bills will put more pressure on households who may otherwise be teetering on the edge of making ends meet.
With this context in mind, it is now more important than ever for local authorities and other services to have access to accurate data on where need for additional help is greatest. As part of our contribution to this, my team at the University of Southampton funded by NIHR ARC Wessex created a new index that maps the areas of the UK where there are the highest risks of household food insecurity.
What the current data tell us
Food insecurity in England is not a new situation, the first food bank opened in 2000. However, though we know there is more demand than ever for food aid like food banks, we do not know how this need is distributed across the country. Only in 2019 did a new survey start collecting data on household food insecurity annually in the UK, through the Family Resources Survey; prior to that, there was the biannual Food and You Survey, which started in 2010. The Food Foundation also collects data more regularly, through YouGov polls with a sample size of about 7,000. However, while these data will tell us how many people are cutting back on food, skipping meals, or running out of food and having no money to buy more in the last 30 days in large areas like Government Office Regions, we do not know where there are higher concentrations of people who need help within these larger areas.
The challenge is, the main response to food insecurity in the UK is to open a food bank or other source of support, like a food pantry where people can choose items of donated food for a small cost. These food aid interventions are run by volunteers and often in locations like churches where they only operate limited hours each week. How do we know the resources to help people are located where they are needed most? Crucially, a lot of these volunteer organisations are supported in part by local government teams who have responsibility to help their residents who are experiencing food insecurity. Knowing where there are more people who may need food can help the volunteers and local government work together to have resources where they can have a strong impact, whether these are food banks or cooking clubs in school holidays.
How we mapped food insecurity
As part of funded research, we talked to people who help households experiencing food insecurity by providing referrals to food banks. We also interviewed people who run food banks, to find out more about the characteristics of people who use their services. In addition, we looked at the published literature to understand what the broad patterns were in households and people who were identifying as food insecure or visiting food banks. Using these qualitative data and literature reviews, we updated a 2018 neighbourhood level food insecurity risk measure to use the smaller areas of Lower Super Output Areas (LSOAs) which each have about 1500 residents. We heard that poor mental health is a key issue, as well as low educational attainment and low incomes. When we had a new version of our risk measure, we showed our maps to the same people and larger groups of colleagues in local government to check that our risk maps made sense, and then updated our data based on feedback.
Our new measure is focused on population characteristics and combines data from the Census, the Department for Work and Pensions (benefits claimants) and the 2019 Index of Deprivation (mental health). In rural areas, we added a separate domain to include structural risk by including data on access to employment, large and medium grocery stores, bus stops and download speeds that is mapped alongside the main measure. We published the methods behind the new measures in December 2022 and then created new data when the 2021 Census data were published.
What we found
Overall, after comparing different combinations of data with outcomes that we know are associated with food insecurity like childhood obesity and free school meals, we know the risk measure works well for small areas in England (areas with more childhood obesity also have a higher risk score, for example).
In our February 2023 update, we updated the composition measure and added access to medium/large grocery stores along with the original four variables. This is important in all areas, as the cost of food in smaller shops is usually much higher than in larger stores and people face this challenge in urban and rural settings.
Our final measures are based on freely available data, updated annually with new data on benefits claimants and store access. These risk data are freely available to download by local authorities across England or to map using our website, and are already part of the Joint Strategic Needs Assessments in some local authorities.