
The 2017 ‘snap’ general election saw a substantial reconfiguration of party support during the short campaign from 18th April to Election Day on 8th June. From polling as low as 25% in mid-April, Labour rose to as high as 40% in the final polls, an estimate that matched their actual vote share. While not historically unprecedented, such large shifts in voting references are rare during the course of a campaign1. In the weeks after the election, the most widely held view was that Jeremy Corbyn had particularly appealed to young people, who turned out to vote at historically unprecedented levels – the so-called ‘Youthquake’2.
In a widely reported study, Prosser et al.3 questioned whether there had been any increase in youth turnout after all. They undertook an individual-level analysis of turnout amongst young people using the 2015 and 2017 waves of the Face-to-Face British Election Study (BES). Using these high quality data sets, they found no change in voting patterns for the under-30s between 2015 and 2017. Independently, the same conclusion was drawn by Curtice and Simpson4 in their analysis of the 2015 and 2017 British Social Attitudes (BSA) survey. While the BSA showed a 5 percentage point increase in turnout (from 56% to 61%) for the 18 to 24 group between 2015 and 2017, this was not statistically distinguishable from no change. In short, using the best data available, there was little in the way of support for the Youthquake theory.
However, while BES and BSA data sets employ gold-standard methodologies, including random sampling and in-home interviewing, they have a key weakness – the small sample sizes on which the comparisons between elections are based. For the BES, the validated vote samples for 18 to 24-year olds were 157 and 109 in 2015 and 2017 respectively. For the BSA, the 18 to 24-year old sample sizes were 289 in 2015 and 162 in 2017. These small samples mean that the probability of failing to reject a true null hypothesis of even quite substantial change in turnout between elections is high, particularly as the effective sample sizes will in practice be considerably smaller, when features of the sample design such as weighting and clustering are taken into account.
So, case closed? Perhaps not. In December last year the University of Essex released Wave 8 of the Understanding Society survey5. Understanding Society is a longitudinal household panel survey which interviews a random sample of the UK population annually on a range of different topics, including voting and party support. A key feature is its very large sample size (around 40,000 respondents at Wave 8). In Waves 2, 7, and 8 of Understanding Society respondents were asked whether they had voted in the most recent election and, if they had, which party they voted for (corresponding to the 2010, 2015 and 2017 general elections, respectively).
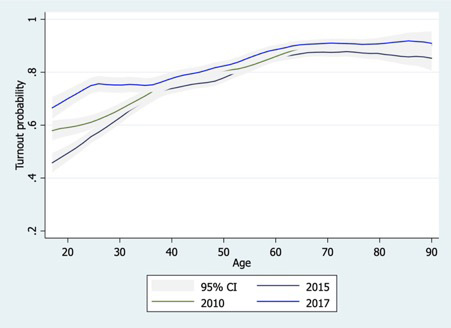
Figure 1. Nonparametric smoothed local polynomial regression probability of turnout by age in years, UKHLS Waves 2, 7 & 8
Figure 1 plots non-parametric regression estimates of the relationship between age and turnout in Understanding Society. The dark blue line which represents turnout in 2017, is clearly and substantially higher for the youngest voters, aligning with 2015 turnout at around the age of 35. Interestingly, the figure also reveals a significant increase in turnout for the youngest voters between 2010 and 2015, a change which has not, to our knowledge, been previously noted – indeed the focus of Ed Miliband’s Labour on youth engagement in the run-up to the 2015 general election was widely derided at the time.
Our analysis of Understanding Society supports the conclusion that there was a spike in turnout amongst younger voters in 2017, with turnout increasing by 9 percentage points for voters aged under 25 and by 13 points for those aged 25 to 29. And, while the moniker ‘Youthquake’ no doubt overstates the true level of increase, the evidence from Understanding Society suggests that 2017 did witness a marked increase in turnout amongst young people.
Read more about Patrick and Will’s Youthquake research at: https://blogs.lse.ac.uk/politicsandpolicy/was-there-a-youthquakeafter-all/
References
1 Jennings, W. (2018). ‘The Polls in 2017’ in Dominic Wring, Roger Mortimore & Simon Atkinson (eds.) Political Communication in Britain: Campaigning, Media and Polling in the
2017 General Election. Basingstoke: Palgrave Macmillan.
2 Travis, A., and Barr, C. (2017). ‘‘Youthquake’ behind Labour election surge divides generations.’ The Guardian, 20 June 2017. https://www.theguardian.com/politics/2017/
jun/20/youthquake-behind-labour-electionsurge-divides-generations 3 Prosser, C., Fieldhouse, E.A., Green, J., Mellon, J., and Evans, G. (2018). ‘Tremors But No Youthquake: Measuring Changes in the Age and Turnout Gradients at the 2015 and 2017 British General Elections.’ Available at SSRN: https://ssrn.com/abstract=3111839.
4 Curtice, J. and Simpson, I. (2018). ‘Voting’ In Phillips, D., Curtice, J., Phillips, M. and Perry, J. (eds.) (2018), British Social Attitudes: The 35th Report, London: The National Centre for Social Research.
5 University of Essex, Institute for Social and Economic Research. (2018). Understanding Society: Waves 1-8, 2009-2017 and Harmonised BHPS: Waves 1-18, 1991-2009. [data collection]. 11th Edition. UK Data Service. SN: 6614, http://doi.