
I’m going to begin this article by asking you to answer a survey question:
In the last 12 months, how often, if at all, have you visited a science museum or science centre?
- Once a month or more
- Several times in the past 12 months
- Once in the past 12 months
- Not in the past 12 months
- I have never visited a science museum or science centre
How long did it take you to choose an answer? You may have done it within just a few seconds, or you might have taken a minute or more. Why does it matter? Well, survey methodologists are increasingly interested in how long it takes respondents to answer questions, so-called ‘response latencies’. This is primarily because response latencies have the potential to be used as an indicator of data quality and also because they offer the potential to improve the cost-effectiveness of data collection. Time is money, as they say, and if we understand why some questions take longer to answer than others, it may be possible to reduce the length of interviews.
In cognitive psychology, response latencies have long been used as an indicator of attitude strength, with shorter latencies taken as indicative of more strongly held attitudes. For instance, a life-long fan of West Ham football club takes little time to respond to a question about her attitude to Tottenham Hotspur, because it is strong and readily accessible. However, if this same individual is asked to evaluate the government’s record on investment in ‘green technologies’, it may take considerably longer to formulate a response if she has not previously given the issue much thought. From this perspective, shorter response times are taken to indicate that an issue is salient to the respondent and that they have a strong attitude about it.
Alternatively, however, short latencies are argued to represent the amount of cognitive effort a respondent has expended in answering a question, with shorter response times indicating less effort and, therefore, a lower quality response. For example, if a respondent is asked a set of opinion questions using the same response scale, he might select the same answer to all questions, so-called ‘straight-lining’, rather than carefully thinking about each individual question and differentiating his answers accordingly. In both cases, the respondent has provided an answer that is acceptable in the context of the survey interview, but which is less accurate than it might have been had more cognitive effort been expended on the task.
Attitude strength and cognitive effort are both respondent-level influences, but another key driver of response latencies is the characteristics of the questions themselves. The number of words, complexity of language, orientation of response options, presence of interviewer instructions, and so on, all affect response latencies in rather obvious ways; longer, more complex questions generally take longer to answer. And, for face-to-face surveys, interviewers also seem to exert an influence on the time a respondent takes to answer questions. It is not entirely clear how this interviewer effect comes about. One theory is that the pace an interviewer reads questions signals to the respondent the speed that they are expected to produce their answers.
NCRM has been undertaking research into the joint influences of respondents, questions and interviewers on response latencies using wave 3 of Understanding Society. Response times for every question are recorded automatically from the key strokes of interviewers as they enter responses into their laptops. We have linked the latencies to the survey data and information about the characteristics of questions, and a separately conducted survey of interviewers who worked on Understanding Society at wave 3, to produce a data file with over 3 million individual records.
We have analysed this linked dataset using cross-classified multi-level models, which enable us to account for the different influences on response latencies, as well as to assess their potentially interacting effects. Our findings are too detailed to present here but some of the headline results are that men, younger people, and people with higher levels of education have shorter response latencies and that respondents who ‘straight-line’ their responses to adjacent attitude questions do indeed complete questions more rapidly. And interviewers have a small but significant effect on response latencies, explaining around 4% of variability in response times over all questions, although the extent of this interviewer influence varies quite substantially over questions.
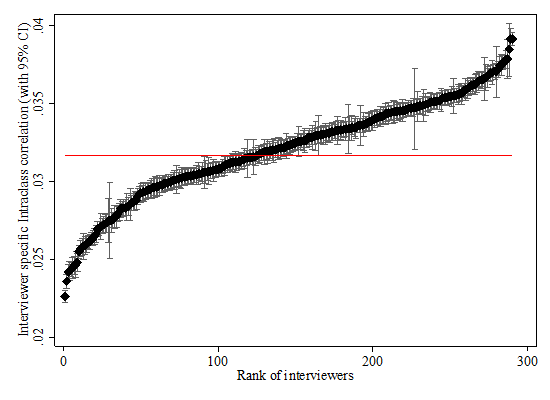
How might these results help us to improve survey practice? Well, one thing we can do with the results of our models is to use them to rank questions and interviewers according to the amount of influence they have on response times. The figure below shows an example of this sort of data visualisation, the black diamonds represent interviewers and are ranked according to the proportion of variability contributed to response times across all the questions they asked on the survey (the red horizontal line indicates the mean of these values across all interviewers). Although these values fall within a reasonably narrow range of low values, it is clear that some interviewers have substantially more influence on response times than others. This information can potentially be used to monitor interviewer performance or to identify problematic questions.
Patrick presented these findings at the NatCen-ESS ERIC-City methodology seminar series in London on 11 October.