
Creative data generation methods: The self-portrait and relational map
Presenter(s): Lucy Robinson
When conducting qualitative research about complex social phenomena like identity or social relationships, creative data generation methods are a valuable tool. Unlike a standalone series of interview-style questions, creative data generation methods provide participants with time for personal reflection and thus remove the immediacy required in answering a series of questions verbally (Clark, 2010; Morrow, 1998; Punch, 2002).
By relying less on speech, the methods can help to facilitate greater involvement and engagement and thus support more inclusive research practice. This is crucial when exploring complex and nuanced topics, as participants may need time to articulate their thoughts and experiences. Moreover, creative data generation methods can be enjoyable for participants as they can stimulate a more relaxed and informal research space and, as such, may result in more open and honest responses (Bagnoli, 2019).
For the researcher, using creative data generation methods can also provide the opportunity for ‘new ways of seeing’ and help uncover the world of an individual’s thoughts, feelings and experiences more so than through speech or text alone (Parry, 2015). In so doing, they can allow for a deeper, and arguably more complete, insight into complex social phenomena.
Self-portrait
Self-portraits are a well-used creative medium in educational settings and allow children and young people to “think holistically about their identities and lives” (Bagnoli, 2009, pp.549-550). Whilst common in a school setting, this method can also be used with adult participants. Moreover, self-portraits do not have to be restricted to a drawing. They can also combine with words (such as words describing identity markers or characteristics).
For this method, participants are asked to draw a self-portrait in the centre of the paper, and then add words or images around. This approach encourages individuals to visually represent their self-perception. The deliberate placement of the self-portrait at the centre of the paper metaphorically centres the participant in the research process, emphasising the significance of their personal narrative to the researcher.
Relational map
Relational maps have a range of names and iterations (for example, concentric circles, family maps, ego-centred maps, network maps) (Bagnoli, 2009). However, the method is most used to investigate relationships. By creating a visual representation of relationships, the method allows the researcher a way to understand their participants’ social dynamics whilst also acting as a starting point for subsequent discussion (Eldén, 2012). As with the self-portrait, participants begin by placing themselves in the centre before using circles or lines to represent relationships.
Relational maps can focus on social relationships whilst also allowing for parasocial relationships (a connection between an individual and someone they do not know personally such as a celebrity, historical figure or literature character) and relationships with non-human entities including imaginary friends, toys and pets, depending on the guidance provided by the researcher (Morrow, 1998). This choice to define different relationship ‘categories’ means the researcher can explore nuances, whilst being led by the participant and without self-imposing or directive questioning. For example, using a relational map can provide insight into how a participant conceptualises their family, the importance of pets or the role of celebrity in their lives. This can be particularly effective if the research topic is potentially sensitive, such as an alternative family structure or challenging familial relationships.
Combining the two
The combination of the two methods allows the participants to centre themselves – literally and metaphorically – in the research and engage with two intertwined themes, identity and relationships. The benefit of this integration lies in the nuanced insights it provides into how individuals conceptualise and situate themselves within their relational contexts. The self-portrait allows participants to articulate their self-perception, emphasising personal narratives and fostering a sense of self-awareness. On the other hand, the relational map enables participants to explore diverse relationship categories, uncovering the subtleties of social dynamics. The combination of the two creates a more comprehensive dataset, as it captures both individual self-reflection and the broader social context in which participants exist.
Whilst the combination of the self-portrait and the relational map is a rich data method as a standalone, combining it with other creative data generation methods and discussion allows participants “to express themselves in a variety of complementary and congruent ways” (Darbyshire, MacDougall & Schiller, 2005, p.424).
Applying the method
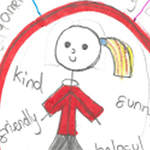
The examples below are the first outputs (of a series) which were created by a research participants involved in the author’s ongoing doctoral research.

Four examples of the ‘self-portrait and relational map’, created by research participants involved in the author’s doctoral research (ongoing).
As part of the process, a basic model was provided by the researcher alongside verbal instructions (see the worksheet for more details). In all instances, the participants created their self-portraits and relational maps in small group settings, whilst engaging in group discussion. After completing their creations, the researcher asked each of the participants to share their output, thus providing further insight into their creation. By allowing participants time to engage in discussion and share their creations, the researcher gained further insight and thus subsequent analysis was more participant-led than researcher-driven (Eldén, 2012).
The research method was enthusiastically embraced by the primary-aged children involved in the project and young people who readily identified as ‘creative’ or ‘artistic’. For others, they showed creative hesitancy, explaining that they “can’t really draw” or that they are “rubbish at drawing”. Fortunately, this was overcome through reassurance and a pre-prepared example with a simple drawing. On reflection, using a model and providing the participants with instructions can be restricting and can limit how a participant wishes to express themselves. However, given the limited time the researcher could spend with the participants (given the research was conducted in a school setting), it was felt that on balance, a model and instruction were necessary.
Data was generated from the children and young people’s creations as well as the subsequent discussion. The examples above, created as part of the author’s doctoral research, provided the researcher with insight into the differing set-up of military families, the role pets and peers play in the service children’s lives and the relative importance that the military has as both an identity marker and as an institution. Moreover, the method allowed the researcher to be participant-led with their follow up questions, based on what they had included on their self-portrait and relational maps. This facilitated the creation of a more natural conversation between the researcher and participants, thus reinforcing the researcher’s desire to create a relaxed and informal research space.

About the author
Lucy Robinson is a final year doctoral researcher at the Department of Education, University of Oxford, funded by an ESRC Grand Union DTP studentship. Her DPhil research explored how military life has shaped service children’s experiences of education and sense of self. Before embarking on her DPhil at Oxford, Lucy completed her PGCE and MEd in Primary Education at the University of Cambridge.
- Published on: 4 January 2024
- Event hosted by: University of Oxford
- Keywords: Qualitative Research | Creative Data Generation | Identity | Social Relationships | Self-Portrait | Relational Map | Participant-Centric Approach | Visual Representation | Holistic Understanding |
- To cite this resource:
Lucy Robinson. (2024). Creative data generation methods: The self-portrait and relational map. National Centre for Research Methods online learning resource. Available at https://www.ncrm.ac.uk/resources/online/all/?id=20836 [accessed: 8 November 2025]
⌃BACK TO TOP